This article is written for the case study of the course I enrolled
lately -
Google Data Analytics.
In this analytic article, I applied the methodology of Data Analytics that data analysts use to
solve problems, which are ASK, PREPARE, PROCESS, ANALYZE, SHARE and ACT, to investigate how severe COVID-19
affected
two listed financial institution’s performances throughout the period.
A clear statement of the business task you have selected to investigate
Business task:
COVID-19 has been spread over the world since 2019, a big strike was also given across different industries in
terms of their financial performance. Hence, I would like to use publicly disclosed financial data of two listed
financial institutions – Wells Fargo (NYSE: WFC) and Bank of America (NYSE: BAC) - to
investigate how severe
their earnings were affected by COVID-19 throughout the period.
Key stakeholders:
public, as this statement will be published on the internet
Dataset:
Self-developed dataset, based on the SEC filings these two companies uploaded on SEC website
(
https://www.sec.gov/
), which are stored as .xml files by XBRL language. A SQL database will be developed to
store the data parsed by python
[2]
, part of the script is referenced by sigma coding “Web Scraping the SEC”
[3] .
Data storage:
data has been generated and cleaned, the raw dataset and cleaned dataset have been stored on
Kaggle
[1] .
Data credibility:
Data used has been cross-checked with the financial reports of the two companies
Data organization:
Data scrapped as structured data and stored in SQL database, with metadata as follows:
| GAAP_code |
STRING |
The company's account codes according to GAAP regulation
|
| Amount |
INTEGER |
The amount of the account at the reporting period
|
| Year |
INTEGER |
Year of the reporting period
|
| CIK |
INTEGER |
CIK code of the company
|
| Company_Name |
STRING |
The company’s name
|
| Report_Code |
STRING |
Report codes according to SEC standard
|
| Ticker |
STRING |
Ticker code of the company
|
| Report_Date |
STRING |
The cut off date of the report
|
| Quarter |
INTEGER |
Quarter number of the reporting period
|
| Segment |
STRING |
Main segment or subsegment of the report
|
| UniqueID |
STRING |
A unique ID number used by SEC |
| Coverage |
STRING |
Year to date (YTD) or Quarter to date (QTD)
|
| Projection |
BOOLEAN |
Whether or not actual figures |
| Owner |
STRING |
Owner of the data |
Error check:
no significant errors detected
Tools used:
SQL, Microsoft Excel, RStudio
Data transformation:
data was extracted as .csv file in order to analyze by excel and import by RStudio easily
Data cleaning:
The data was cleaned by SQL script, which is stored on GitHub
[2].
The script deals with:
| 1) |
Filtered out duplicate data |
| 2) |
Added two computed columns -
Amount_QTD
and
Amount_QTD_pre
to facilitate further analysis
|
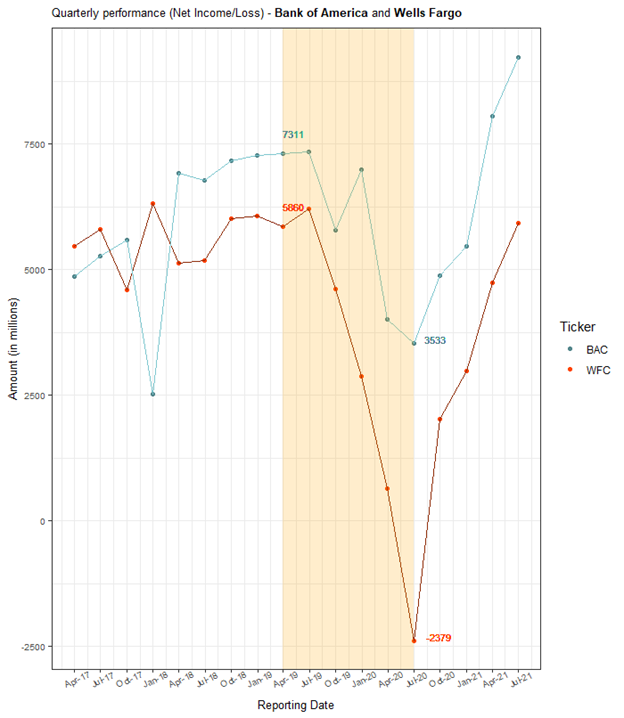
According to the data from their quarterly financial filings (i.e., 10-Q and 10-K) through plotting by RStudio
[2]
, it is clear to see, during COVID-19 season, which is ranged from Q1 2019 to Q2 2020 colored in yellow, both
companies suffered an apparent performance downturn.
Their performances declined from US$7,311M and US$5,860M to US$3,533M and -US$2,379 (or -51% and -141%)
respectively. However, the resilience of Bank of America (Ticker: BAC) was obviously almost three times (3x)
stronger than its competitor, Wells Fargo Bank (Ticker: WFC).
Moreover, it is believed the stronger resilience of Bank of America made himself to regain faster than Wells
Fargo in the post-COVID period, which can be seen from the chart that BAC’s earnings had already reached its
pre-COVID peak in Q4 2020, whereas WFC had not achieved this goal at the end of Q2 2021.
In conclusion, the impact of COVID-19 had influenced both US-based financial institutions negatively.
Nevertheless, these two companies handed out largely different results in terms of their profit-earning
capability. This could be due to different reasons, the most common could be management competency, customer
demography, asset quality etc.